With the huge number of electronic gadgets attached to a bike these days, it's inevitable that cyclists will be inundated with data. From speed, cadence and heart rate to power data (and even new technologies such as muscle oxygenation data), there's a mind-boggling collection of numbers to consider. But why even bother collecting data? Evaluating ride data is one of the biggest reasons most cyclists collect data and it can tell you a lot about your ride if you know how to look at it the right way.
In this video, I'll walk through evaluating ride data from several race performances. I'll describe what I look for and how you can use that information to improve your training and riding.
Podcast: Play in new window | Download (Duration: 32:49 — 739.1MB)
 Tips For Evaluating Ride Data
You've logged a bunch of rides, now you need to start evaluating ride data to get anything out of it. When you're starting to look at data files, you may find there's so much information to digest that you're simply overwhelmed by everything. By breaking your evaluation process down into simple parts, you can gather a lot of information about how successful you were in your goals for that ride or race. Read through each of the steps below and learn how to get some valuable insight into your riding and training.
Basic power and intensity metrics: Average power, TSS, IF, VI
Look at average power, IF and VI for ideas of how “even” the ride/race was. Remember that average power measures time spent coasting, so a low average power isn't necessarily a bad thing. This is especially true in a crit, road race or group ride (it may be concerning in a time trial.) Intensity Factor is a measure of how difficult a ride was compared to your current threshold of fitness. (You can read more about IF in my blog post on Quantifying Training Stress Score and Fatigue.) The short version is this: any IF above 1.05, if you're not completely spent, means your FTP is not correctly set and you need to revisit it (assuming you're not a prologue TT rider, of course!)
Training Stress Score is described in detail in the above-mentioned blog post. It is simply a reflection of how difficult the ride or race was. It also measures how much fatigue it created in your body.
VI or Variability Index is a measure of how evenly paced the effort you performed was. This metric has little value in a crit, road race or group ride, but is invaluable to a Time Trial rider. The higher the VI, the more stochastic, or uneven your application of power was. Here's an example for you: you're riding down the road, you suddenly jump up and sprint, then sit down and coast. That is an “uneven” effort. Next time, in the same stretch of road, you maintain a constant cadence and power level. This is an “even” effort. TTs require pacing yourself and keeping yourself as close to your max as possible without going over. So in a time trial, the more even the effort, the better.
Power evaluation metrics: Peak 20-minute power, FTP and Average Power
Peak 20-minute power is the maximum amount of power you produced in any given 20-minute duration. It is important because it's typically the evaluation of choice for performing FTP calculations. A simple 20-minute peak power average can reveal changes in FTP before a formal test. This will allow you to evaluate if you're progressing between tests or not.
Conversely, FTP, or Functional Threshold Power, is the maximal amount of power you can produce without “going into the red.” It's the standard non-laboratory measurement for fitness that most cyclists will use. I've covered FTP previously, and you can read about it in this blog post.
Average power, as I mentioned above, is a value that includes your periods of coasting.
Normalized Power is a non-zero average of your power. In other words, it's the amount of power you produced while you were pedaling. It also ignores zeroes. This can be valuable to see if your FTP is set correctly since IF (discussed above) is a ratio of normalized power to threshold power. Consistently high NP compared to FTP, or IF above 1.05 for a 1-hour event shows that there's some mistake in your FTP value. Or, you may just be getting stronger!
When evaluating a TT, peak 20-minute, average power, NP and FTP should all stack up pretty much the same. In a road race, crit or group ride, average and 20-minute power generally fall well below FTP and NP. If you start seeing 20-minute power around your FTP for a group ride or road race, your fitness is lagging a little bit for the level of competition you're at.
“Smart Riding Metrics”: Power Distribution and Quadrant Analysis
Power distribution charts can give you an idea of how “smart” you are riding. For a road race, you'll want to see a “V” shaped distribution chart. This means you're spending proportionally more time coasting or soft pedaling and in zone 6/7. You're not wasting energy in the dead zone of Zone 3 and 4 during a road race. Basically, you're making use of the “hide in the pack, save it for the attack” mentality. Contrast this with a time trial where most of your time is in zone 4 or functional threshold power level. This will create an “inverted V” shape of the distribution.
Quadrant analysis is another useful “smart riding” metric. It basically tells you how you made your power: did you mash it out with low cadence, high tension work or did you spin your way to big power. In a road race, you'll want to see lots of activity in Q3, which is low speed, low force. You'll see some activity in Q4 which is high speed, low force. You'll see a few points in Q1, which would be sprints, attacks and covering attacks. If you're spending a lot of time in Q2, you'll need to work on your neuromuscular capacity.
In a TT, you're looking for a tight grouping right around your functional threshold power curve. You'll see most of your power made in Q1 and Q4. In reading the QA, if you find a couple of things of note. If you're deviating into Q2 and Q3, you probably need some force production training. Consider doing some strength training or some other on-bike force work.
Additional Power and Efficiency Metrics
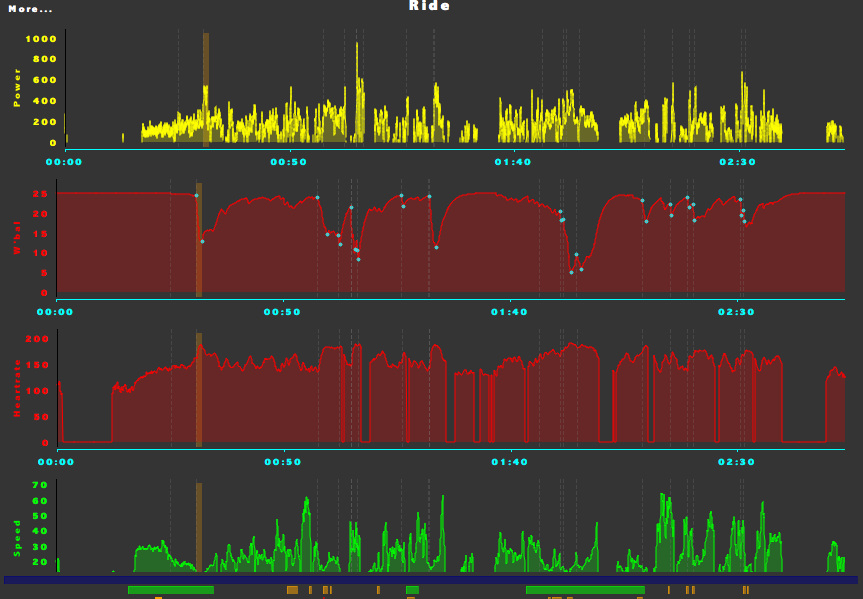
There are a couple of other metrics you can use to evaluate your ride data. One is the FTP bar. This is simply a horizontal rule placed on the “power” graph of your ride data. It gives you a visual representation of where your efforts were made and how much of your effort was above threshold. This is particularly useful in a time trial situation so you can evaluate if your power production falls in line with your functional threshold power at a quick glance. You can also use this tool to determine if you achieved the “negative split” that is so desirable for a time trial type effort.
Cadence can be broken down to determine how much time was spent pedaling. This varies dramatically between road races, crits and time trials. In a TT, you'll be pedaling the whole time. In a road race or crit, you should be coasting most of the time. It's another indication, along with some self-reflection, of how smart your racing and training is.
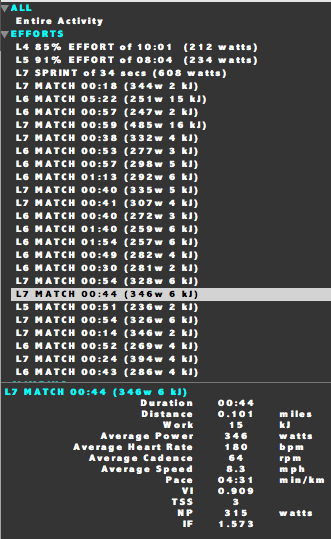 The “matches” function, or “find intervals” function can tell you how many matches you've expended in the course of a ride. What is a match? In Golden Cheetah, a match is designated as a single effort above functional threshold power and burning at least 2 Kj of energy. Since matches are a finite resource, you need to learn how to preserve them. By evaluating where you burned matches, you can determine if you need to work on building your matchbook or just race a little bit smarter.
By combining the matches window with the W' graph, you can determine how each match affects your remaining available anaerobic energy. According to some recent research by Phil Skiba, W' is simply a measure of how much work capacity you have above your critical power (which is essentially your functional threshold power.) Matches are expressions of that work capacity, so excessive burning of matches means you have less anaerobic work capacity available when it counts.
You'll need some personal insight in order to determine if the matches burned were necessary or not. In some cases, you'll be able to say that you had to move through the pack or cover a dangerous move. In some cases, you may have been caught out of position and had to burn precious energy getting back to the front. If you can evaluate your performance objectively, you can learn a lot about it from the matches you burned.
As a side note, you can determine if you need to re-evaluate your W' setting or CP setting if you consistently see a negative “% W' expended” number.
Dictating Future Training
By looking at your CP curve, you can determine some areas that you may need to focus on in training. By using an “extended CP” evaluation, you'll have an idea of what power numbers your body should be capable of producing given your CP or functional threshold power. You can see where your actual power numbers fall under this curve and where you need to train to improve to your “potential.”
Beware: not everyone is able to match their predicted power numbers. Some people have physiology that dictates a certain power curve, so don't panic if you just can't budge that 3-minute power number. Your actual performance on the road is far more important.
Think you're ready to evaluate your own data? If you're still struggling, send me an email and I can help you out. If you're struggling to meet your training goals, you can pick from a ton of great training options in my downloadable training plan store, including my new Unbreakable Core Stability module and my upcoming Track Module which will help you sprint like a Ferrari. You can also get a ton of great training tips FOR FREE by signing up for the Tailwind Coaching Newsletter. You'll also get a free bonus training plan, updates, and exclusive discounts like the Unbreakable Core Stability discount!
If you enjoyed this episode, please do me a favor and head over to the Tailwind Coaching Podcast on iTunes and rate it 5 stars. A positive review helps the podcast move up the ratings, reach more listeners, and help more people get stronger, faster and fitter. Don't forget to post any questions to the Tailwind Coaching Facebook page, on the Tailwind Coaching forums, contact me via email or leave a comment below. Don't forget to support our sponsors and help to keep this podcast free, help me to get this information to more people and help grow the cycling community.